Blog
Max drawdown: What 98 years of S&P 500 falls show
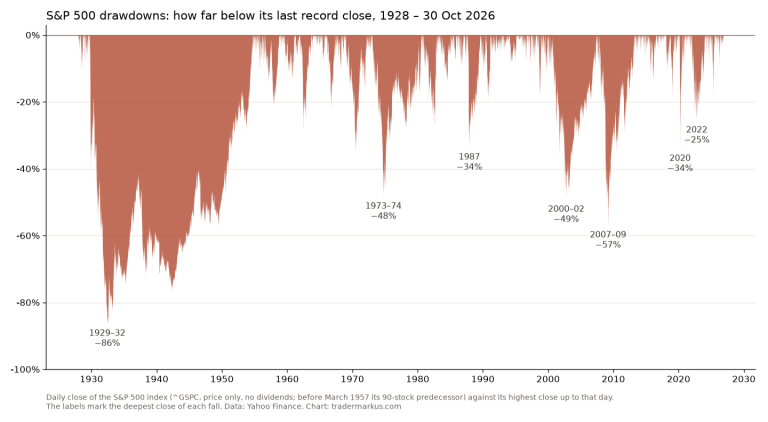
Max drawdown is the biggest fall from a peak to a later low, in percent. For the S&P 500 it is −86.2%, from September 1929 to June 1932, and the…
Essays on trading psychology and method, chart reads and market notes, since 2018.
125 posts · page 3 of 21Max drawdown is the biggest fall from a peak to a later low, in percent. For the S&P 500 it is −86.2%, from September 1929 to June 1932, and the…
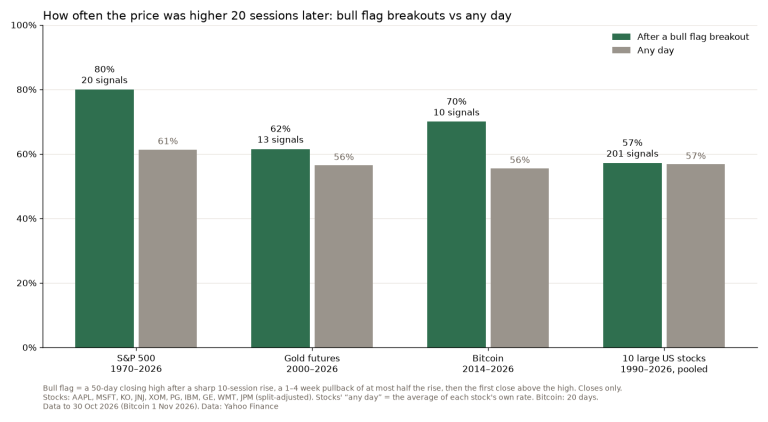
A bull flag is a sharp rise, a short pullback that drifts lower, and a breakout above the high. I tested 244 of them with fixed rules on the S&P 500…
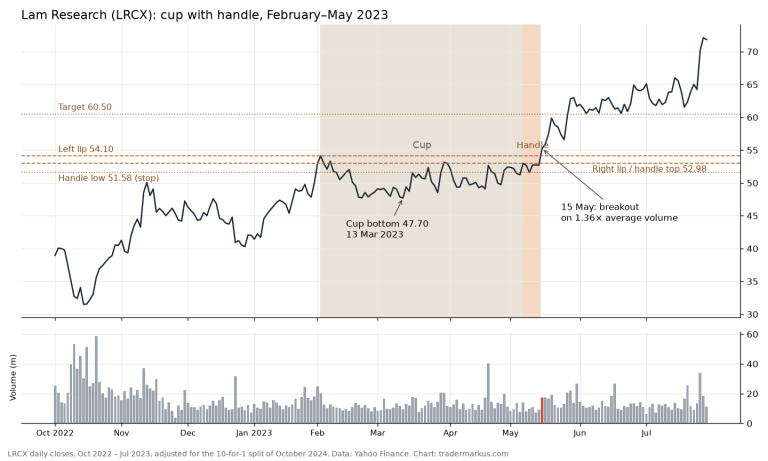
A cup and handle is a bullish continuation pattern: after a rise, the price builds a rounded, U-shaped base (the cup), pulls back a little near the…
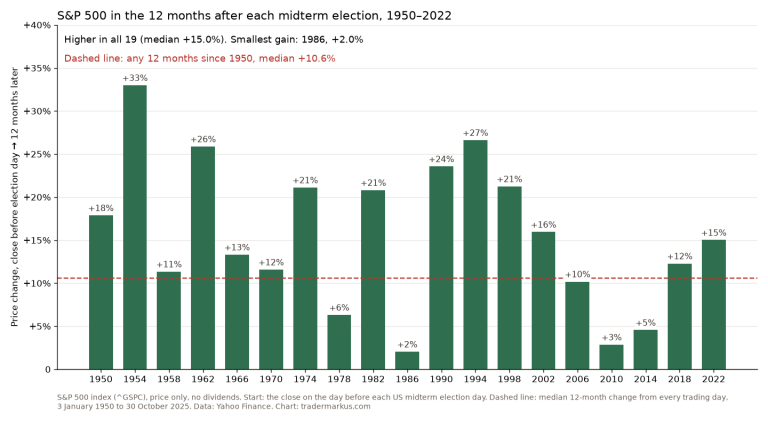
The US midterm elections were held on Tuesday, 3 November 2026. I looked at what the S&P 500 did after every midterm since 1950. Twelve months after…
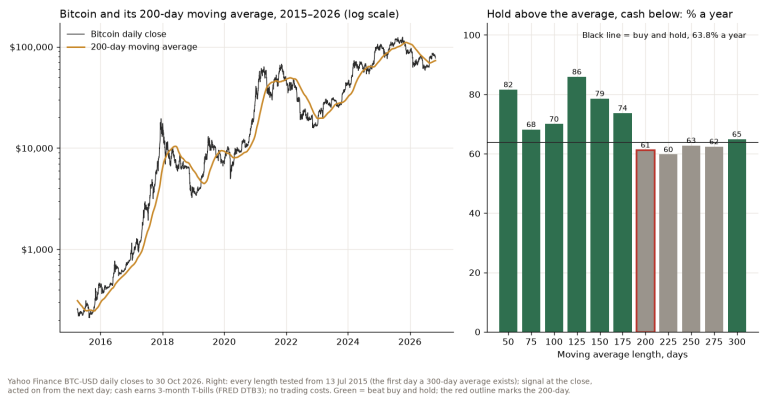
Bitcoin’s 200-day moving average was $72,922 on 15 November 2026, and Bitcoin closed 10.4% below it. Its first close under the line since August came…
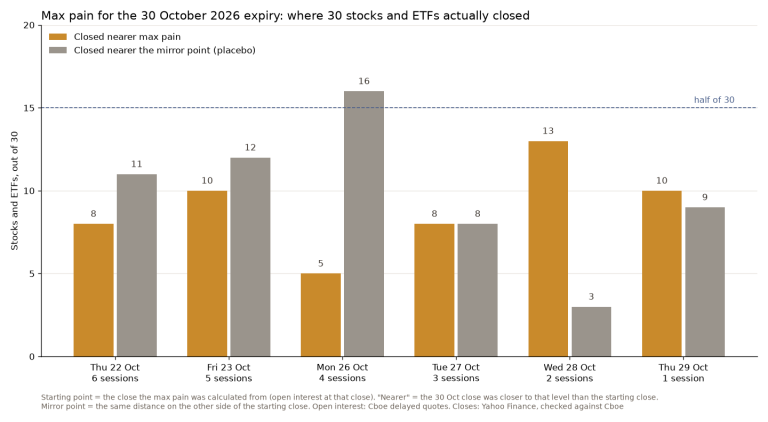
Max pain is the strike price where option holders would collect the least at expiry, and the theory says the stock gets pulled toward it before…
Type a word or a book title. Titles, excerpts and tags are searched.