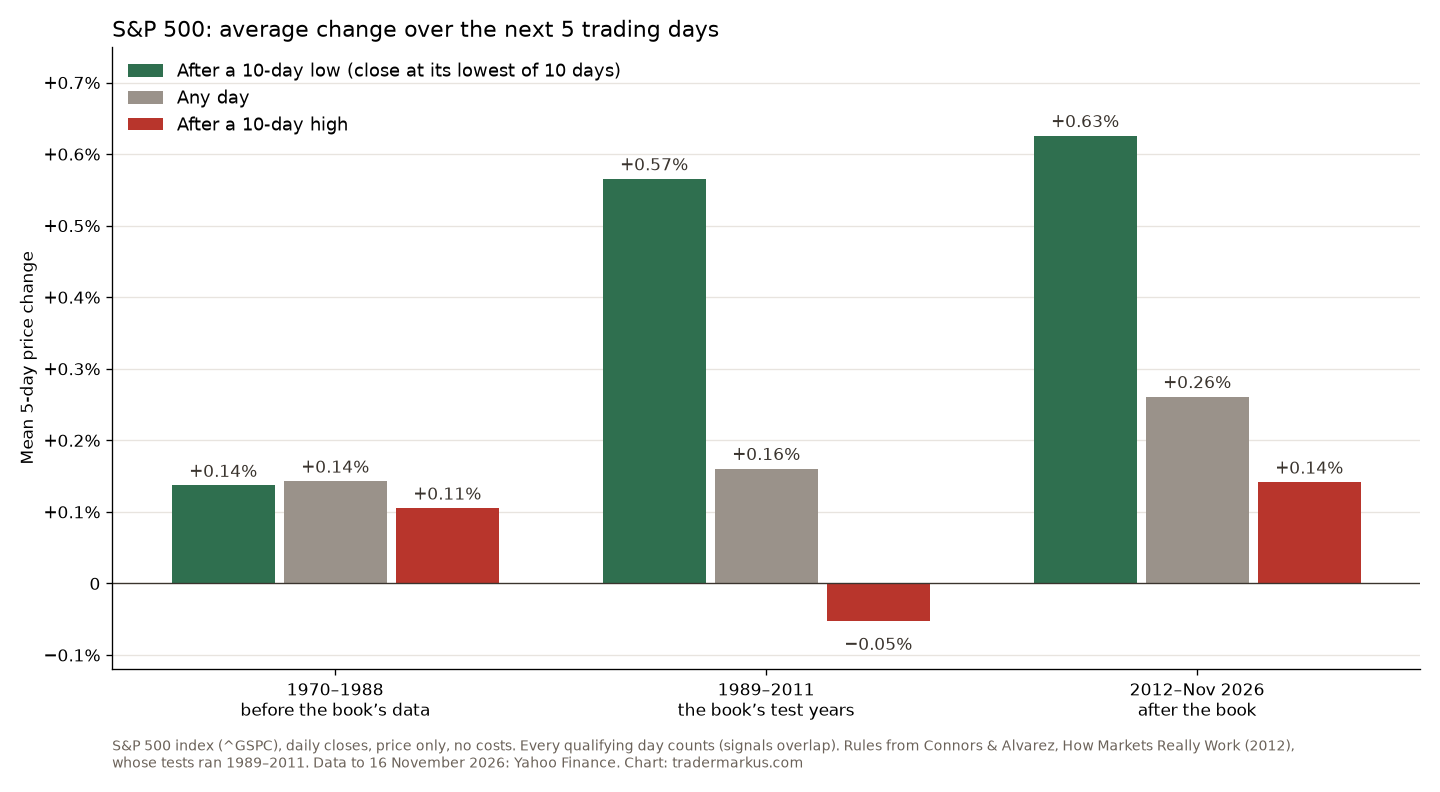
Mean reversion is the bet that a short move away from normal snaps back. Larry Connors and Cesar Alvarez tested it on the S&P 500 from 1989 to 2011 and found that buying short-term weakness beat buying strength. I re-ran their rules on the years after their book came out. From 2012 to November 2026, the index rose an average of +0.63% in the five days after a 10-day low, against +0.26% for any day and +0.14% after a 10-day high. The edge is still there. Before 1989 it wasn’t.
Most mean reversion articles stop at the definition. The useful question is whether a pattern that was found in old data kept working once it was published, because that is the only part a trader can use.
What is mean reversion?
It is the idea that prices that move too far, too fast, tend to come back toward their average. A mean reversion trader buys after a sharp fall and sells after a sharp rise, usually for a few days. It is the opposite of trend following, which buys strength and expects it to continue.
Both can be true at once, on different time scales. An index can trend up for years and still snap back after most three-day falls.
What Connors and Alvarez found
When I reviewed How Markets Really Work, the 2012 second edition, the main message was simple: on the S&P 500, buying short-term lows had beaten buying short-term highs. The market was lower on average a week after a 10-day high, three or more up days in a row lost against the average week, and big down days beat big up days over the next few days. Their tests ran from 1989 to 2011, and they found the RSI(2) the best single indicator of the lot.
They put the market’s average at 0.03% a day and 0.15% a week over their test. My data for the same years gives +0.03% and +0.16%, so we are looking at the same index.
How I tested it
I used daily closes of the S&P 500 from 1970 to 16 November 2026 and split them into three periods: before their data (1970 to 1988), their test years (1989 to 2011) and the years after the book (2012 to November 2026). For each day I measured the change over the next five trading days and compared it with the same measure from every day in the period. The rules:
- A 10-day low is a close that is the lowest of the last 10 closes. A 10-day high is the same at the top.
- Three or more down days means at least three lower closes in a row. Up days are the mirror image.
- No costs, and every day that qualifies counts, so signals on back-to-back days overlap.
Did it still work after the book?
| Average, next 5 days |
1989–2011 | 2012–2026 |
|---|---|---|
| After a 10-day low | +0.57% | +0.63% |
| After a 10-day high | −0.05% | +0.14% |
| After 3+ down days | +0.66% | +0.72% |
| After 3+ up days | −0.01% | +0.24% |
| Any day | +0.16% | +0.26% |
The average change in the S&P 500 over the five trading days after each kind of day.
Yes. In the years after the book, a 10-day low was followed by a rise in 64.1% of cases, against 60.4% for any day, and three down days in a row by a rise in 66.7%. Buying strength stopped losing money, because the whole market rose faster after 2012, but it still trailed an average day.
Before 1989 it went the other way
The years before their data are the part I didn’t expect. From 1970 to 1988 a 10-day low was followed by the same average five days as any day, +0.14%. After a fall of more than 1%, the next day was down on average (−0.28%) and higher only 40.7% of the time. After a rise of more than 1%, the next day was up +0.27% on average. Short moves kept going instead of snapping back.
So mean reversion is not a law of markets. It describes how this index has behaved since the late 1980s, and nothing says it has to stay that way.
The RSI(2) strategy
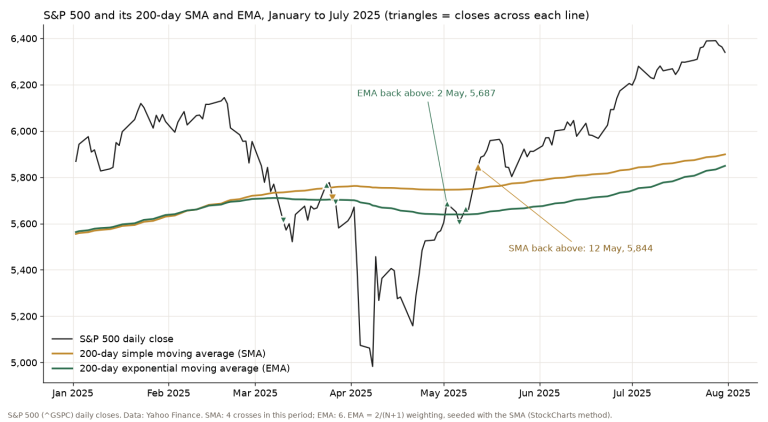
The best-known version of the idea is Connors’ 2-period RSI. StockCharts’ ChartSchool sets out his rules: only buy when the price is above its 200-day moving average, buy when the 2-day RSI closes below 10, and better below 5, and sell on the first close above the 5-day moving average. No stop loss. I tested exactly that, one trade at a time, with 0.05% off each round trip for costs, my own assumption. When the strategy is out of the market, the money earns the 3-month T-bill rate, and I compared it with holding the S&P 500 with dividends.
| RSI(2) below 5 |
1989–2011 | 2012–2026 |
|---|---|---|
| Trades | 95 | 71 |
| Winners | 85% | 80% |
| Average trade | +0.83% | +0.68% |
| Any entry, same days | +0.11% | +0.17% |
| Time in the market | 5.8% | 6.0% |
| Per year, with T-bills | +6.8% | +4.7% |
| Buy and hold, per year | +9.2% | +14.6% |
| Worst fall, strategy | −14.2% | −8.4% |
| Worst fall, buy and hold | −55.3% | −33.8% |
The average trade made several times what a random entry held for the same number of days made, and that held after the book too. At least four out of five trades won. The catch is in the per-year line. The strategy is in the market about 6% of the time, and the rest of the time the money only earns the T-bill rate. Since 2012 that added up to +4.7% a year while the index with dividends made +14.6%.
The worst trade shows what no stop means. The rule bought on 27 July 2011 and the next close above the 5-day average came on 11 August, 10.1% lower. Since 2012 the worst was the start of the Covid crash, bought on 24 February 2020 and sold on 2 March for −4.2%. From 5 March the index closed below its 200-day average, so the rule sat out the rest of the fall to the 23 March low.
Where it stood when I wrote this: on 16 November 2026 the S&P 500 fell 1.9% to 7,416.59. Its 2-day RSI closed at 9.8, and the index was still 1.0% above its 200-day average of about 7,343. That is a buy for the below-10 version of the rule and not yet one for the below-5 version. That’s the backtest rule talking. I’m not making a call on next week.
What about Bitcoin?
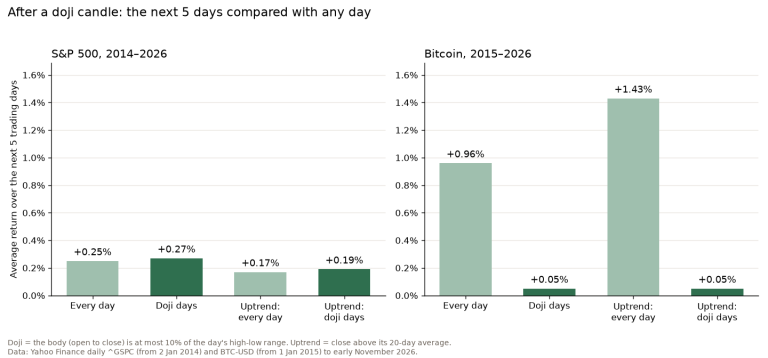
Bitcoin doesn’t show it cleanly. The median five days after a 10-day low was +0.79%, against +0.42% for any day, which looks like mean reversion. But the average five days after a 10-day high was +1.98%, more than twice the +0.87% for any day, because Bitcoin’s biggest gains came in runs. The RSI(2) rule won 77% of its 57 trades since mid-2015, and it still couldn’t come close to holding Bitcoin through those runs.
My view
When I reviewed the book I wrote that this looked like the character of the index in their time frame, not something every stock does, and that I’d be careful with the advice to trade without stops. The data since then fits both. The index kept doing it for almost 15 more years. It didn’t do it in the 1970s and 1980s, and Bitcoin doesn’t do it in a way you can trade on its own.
For me a short-term dip inside an uptrend is a place to look for an entry, not a reason on its own. The 200-day filter in the RSI(2) rule says the same thing: it only buys weakness when the bigger trend is up. And I still want a level on the chart where I’m wrong. If the edge is a few tenths of a percent a trade, one 10% loss without a stop takes a long time to win back.
If you want the investor’s version of the same question, waiting for a 10% or 20% fall to put money in, I tested that in buy the dip. It’s a different trade, and on the S&P 500 it didn’t pay.
FAQ
Does mean reversion work in trading?
On the S&P 500 since 1989, short-term weakness has been followed by better-than-average days, before and after Connors and Alvarez published it. In 1970 to 1988 it wasn’t, and on Bitcoin it isn’t clean. Test it on the market you trade.
What is the RSI(2) strategy?
Larry Connors’ rule: with the price above its 200-day moving average, buy when the 2-period RSI closes below 5 or 10 and sell on the first close above the 5-day moving average. On the S&P 500 since 2012 it won 80% of its trades, but it was in the market only about 6% of the time.
Is mean reversion the opposite of trend following?
On the same time scale, yes. In practice they work on different ones: mean reversion trades last days, trend following trades last months. The RSI(2) rule uses both, a long-term trend filter and a short-term dip, and the lower Bollinger Band showed the same short-term snap-back on the S&P 500.
Not financial advice. This is educational content, shared for information and entertainment only, and it is not a recommendation to buy or sell any asset. Backtests and past results do not guarantee future results, and the numbers or charts here may contain mistakes. Trading carries risk, including losing all the money you put in. Do your own research before you make any decision.