Blog
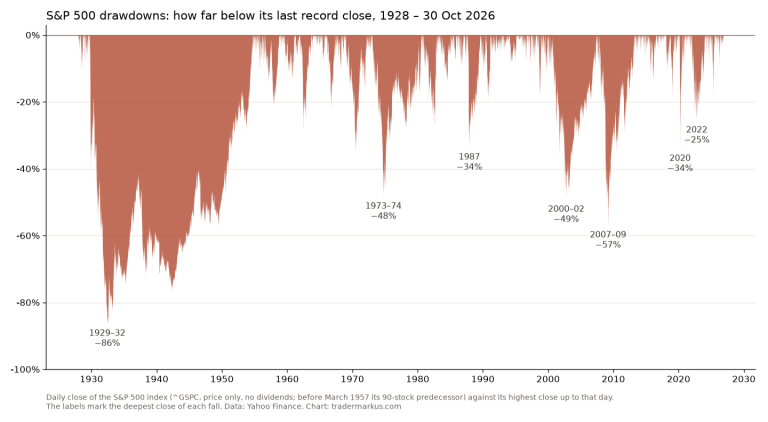
Max drawdown: What 98 years of S&P 500 falls show
Max drawdown is the biggest fall from a peak to a later low, in percent. For the S&P 500 it is −86.2%, from September 1929 to June 1932, and the…
17 posts tagged BTC, newest first.
17 posts · page 2 of 3Max drawdown is the biggest fall from a peak to a later low, in percent. For the S&P 500 it is −86.2%, from September 1929 to June 1932, and the…
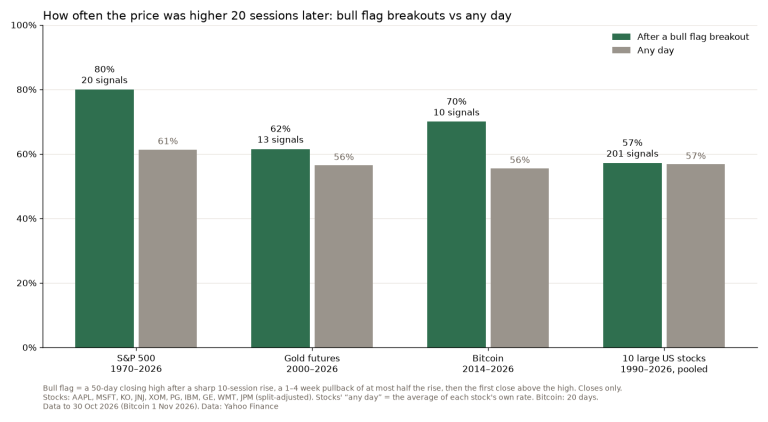
A bull flag is a sharp rise, a short pullback that drifts lower, and a breakout above the high. I tested 244 of them with fixed rules on the S&P 500…
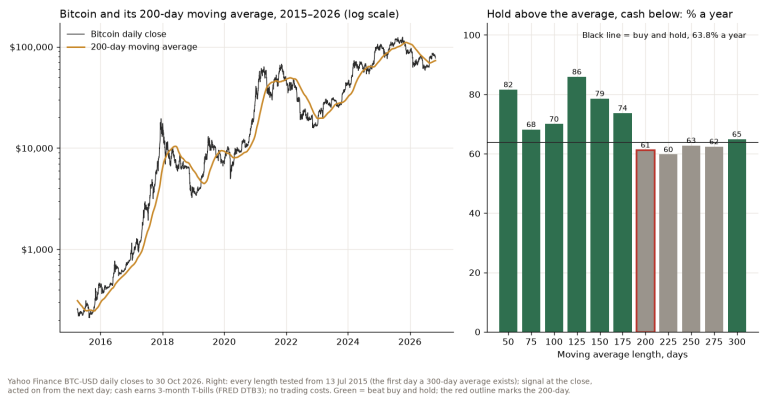
Bitcoin’s 200-day moving average was $72,922 on 15 November 2026, and Bitcoin closed 10.4% below it. Its first close under the line since August came…
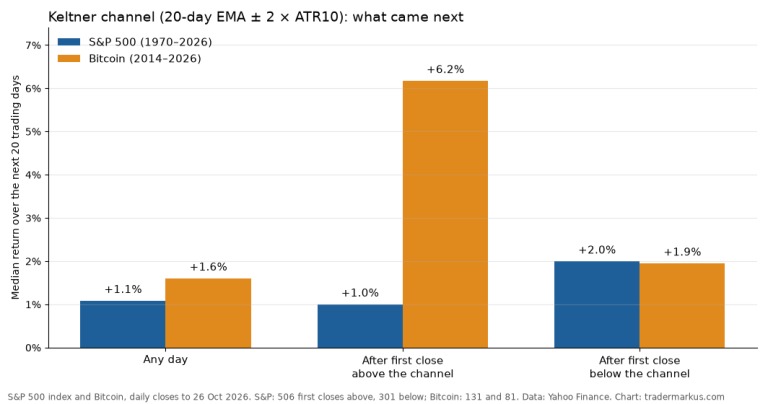
A Keltner channel is a 20-day exponential moving average with a line two average true ranges above it and two below. I tested it on 56 years of S&P…
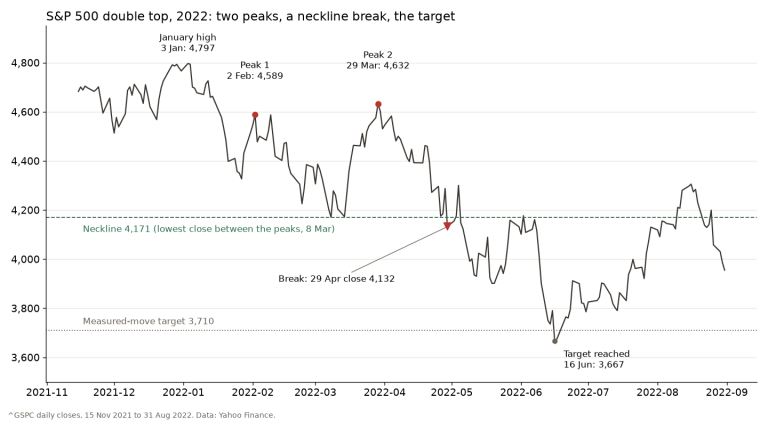
A double top is two peaks at about the same price with a dip between them. It counts as confirmed when price closes below the low of that dip, the…
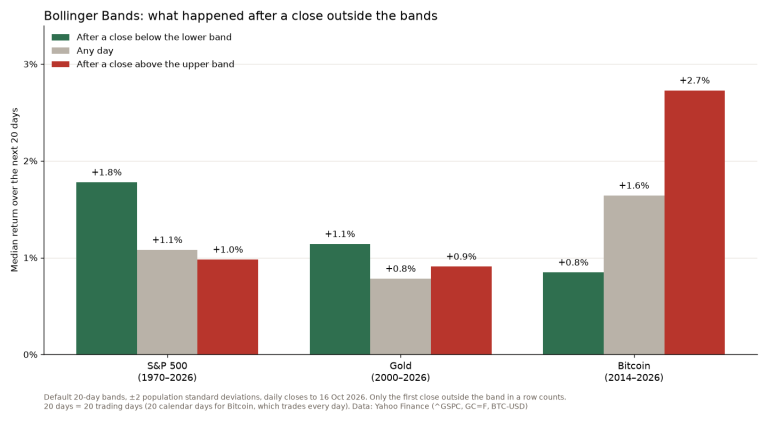
Bollinger Bands are a 20-day moving average with a band two standard deviations above and below it. I tested John Bollinger’s own rules on the S&P…
Type a word or a book title. Titles, excerpts and tags are searched.